How is higher education enrollment changing, and what might it become in the future?
These have been long-running interests of mine. Today  the National Student Clearinghouse Research Center just released its updated spring 2026 data. In this post I’ll dig into it to highlight what I see as the leading points.
Overall, many of the topline findings are quite positive. Total postsecondary enrollment in American higher ed grew by 1%, reaching 18.6 million. But there are interesting differences across the sector.
1 Findings
We can break this down in several ways, starting with degree levels. Undergraduate education was where the growth took place, as grad schools actually saw numbers decline slightly (-.1%). Public and nonprofit grad schools experienced a decline, countered only by a rise within for-profits. Within the undergraduate world it was public institutions which experienced a rise; for-profit and private institutions did not.
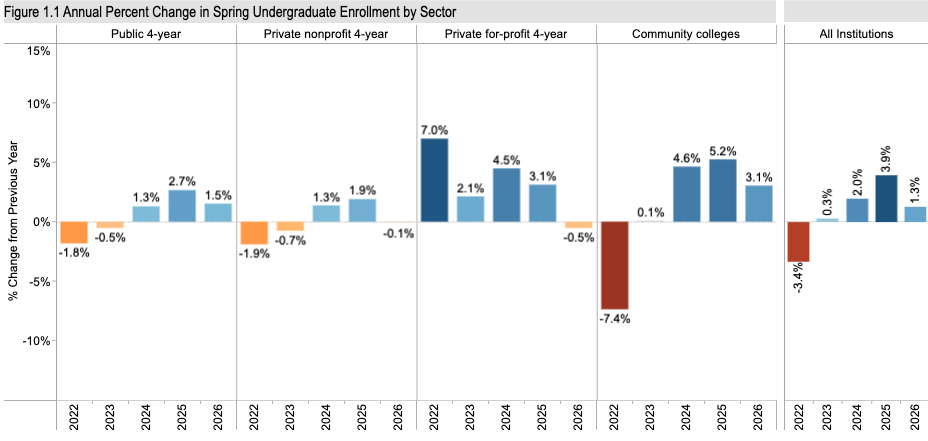
Importantly, that undergraduate increase was largely driven by… high school students, taking dual enrollment classes. That number soared by 9.6% for a total of 1.3 million, or about 7% of the entire American student body.
In terms of degrees sought, there were slight increases in associates (1.3%)and bachelors (1%), but the big increase by far was in certificates (10.2%).
There was an important finding about online learning. The Clearinghouse identifies a category of schools as Predominantly Online Institutions, and their numbers sagged down by 3.6%. Grad students online were stable; it was undergrad students where the decline appeared.
International student enrollment was curiously split. The number of foreign students in grad programs declined significantly, by 4.3%, especially in public institutions. Yet international students actually rose by 3% in undergrad programs.
Demographic findings tracked recent history closely. The gender divide continued, as with roughly 55% of undergraduates being women versus 40% male.* While both genders rose, there was a higher growth rate among women in in both grad and undergrad levels.
Racial trends similarly continued. Hispanic, black, and multiracial student numbers rose while white numbers declined.
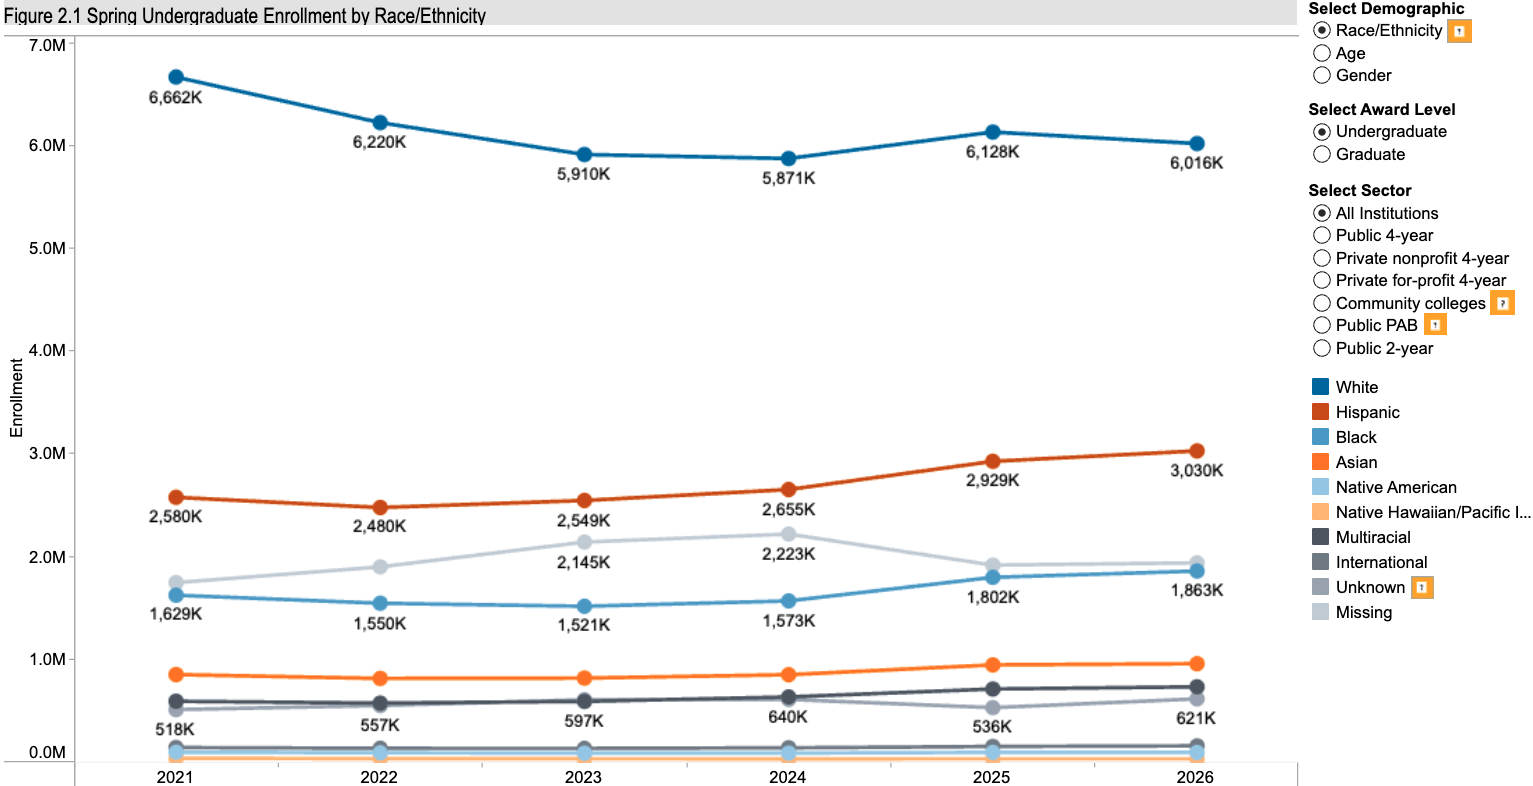
This is all undergraduate. Click through for more.
There was also a large increase for students who choose not to reveal their identities.
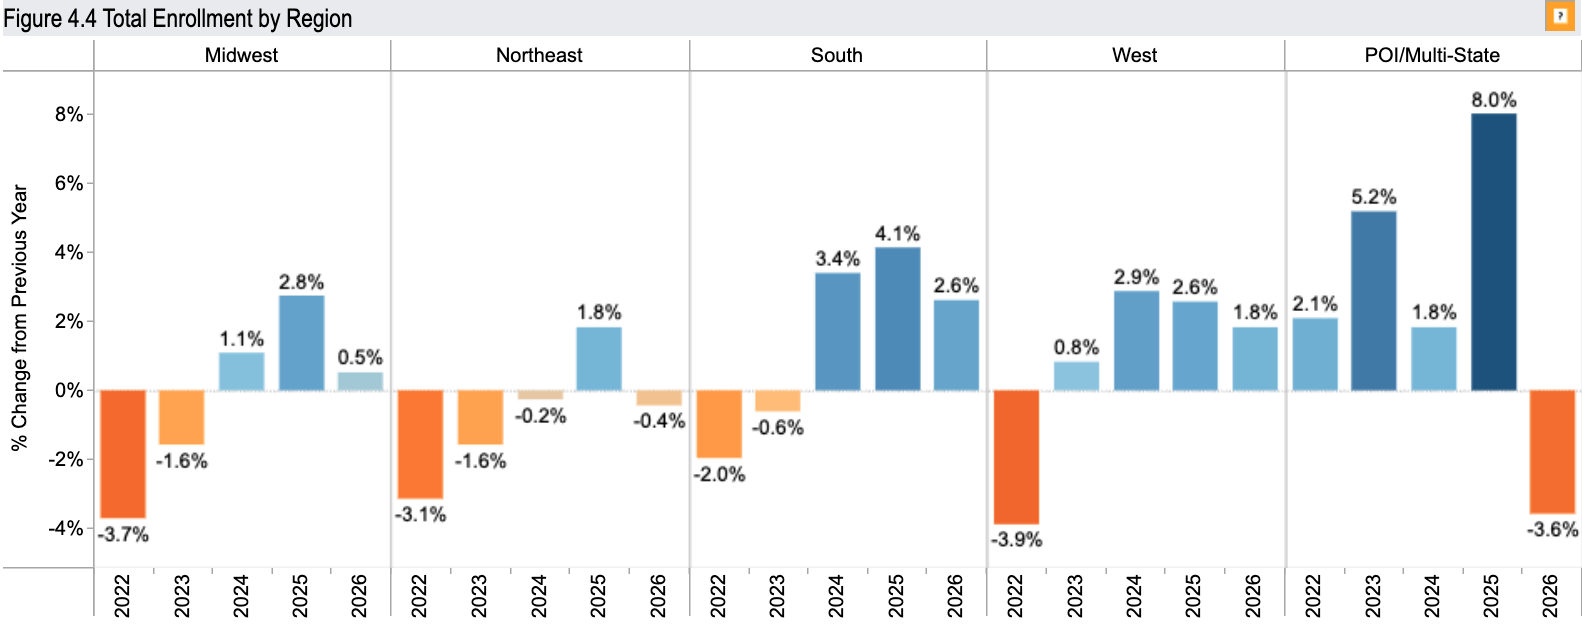
Georgraphically, colleges and universities in the west and especially south saw enrollment increases. In contrast midwest institutions saw a slight rise while the northeast saw a larger decline:
In terms of fields of study, some patterns persisted, such as business continuing to be *the* leading major. Yet computer science dropped sharply across all sectors, a clear reaction to the AI revolution. At the same time health care fields continued to grow. In our briefing discussion we estimated around 2 million students study in allied health. (My back of the envelope number was 2039507, or around 11% of all enrollment).
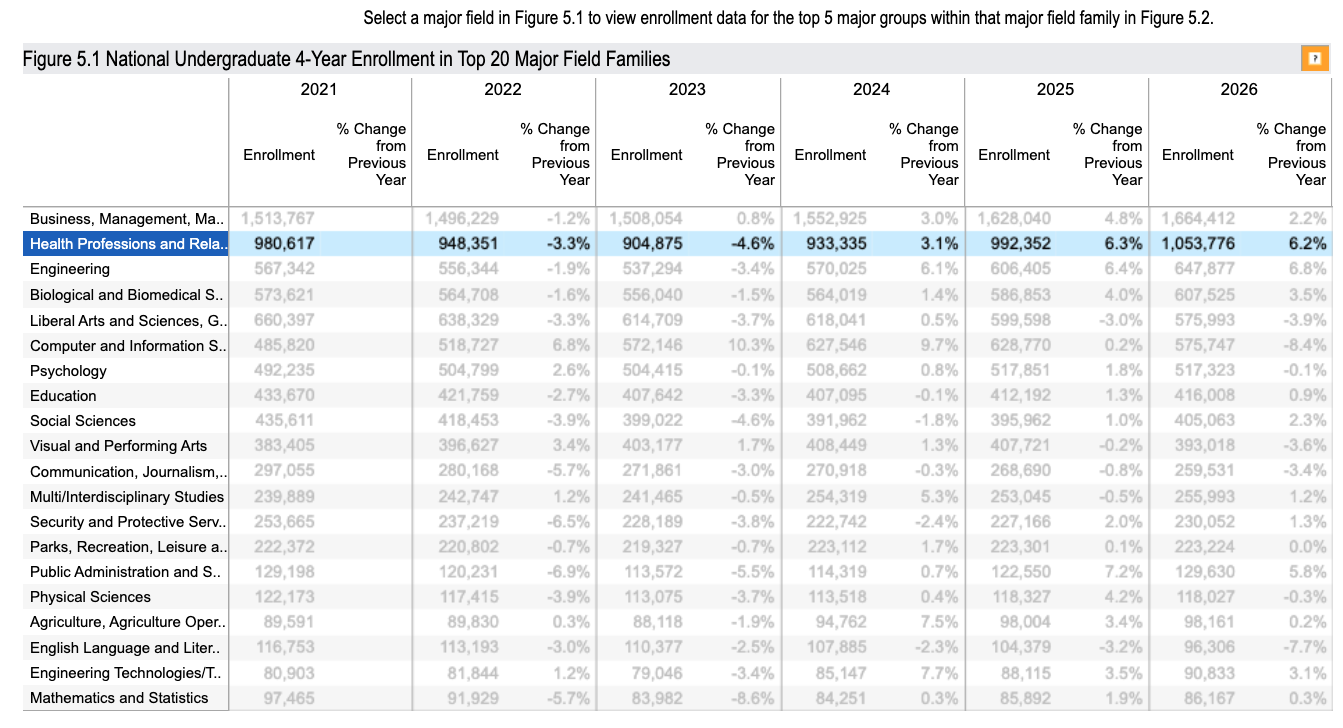
NB: this is only for 4-year institutions. Click through to the Clearinghouse site for more.
2 Reflections
I was struck by the huge scale of dual enrollment, which continues to grow and seems to be the primary driver of American post-secondary numbers. If my calculations are right, 7% of the entire student body is high school students. That’s a major shift.
I’m glad to see total enrollment continue to tick upwards. My readers know the two reasons already. First, most colleges and universities depend on enrollment to pay their bills, so this is – broadly – good news for financial sustainability. (However, those total numbers mask how much students actually pay. That’s for another post.). Second, continued enrollment growth, albeit slight, shows some results for the old “college for everyone” idea.
Does this put paid to my peak higher ed scenario? Well, it certainly troubles that story. Yes, we did see enrollment decline for more than a decade, which confirmed my initial projections. But the past two years of growth suggest a rebound. If they continue we will soon recover our peak class size. If that occurs, 2012 wasn’t a peak so much as the start of a dip or reverse, which American colleges and universities eventually recovered from. We might think of circa 2012-2024 as a limited dip or depression.
How and why did we rebound? Again I’m struck by the dual enrollment movement, which seems to be an underdiscussed story. It’s not so much that, say, liberal arts colleges and research universities won American hearts once more but that community colleges and high schools built up a partnership. In my scenario I advised campuses to innovate and better serve students to recover from a fall; to the extent dual enrollment represents such a move, it’s consistent and a good thing.
Could enrollment decline again? There are several ways, starting with international students. I was surprised by the Clearinghouse numbers there, where I expected a much bigger drop. We could see a similar or steeper decline this fall, depending on geopolitics and families’ perceptions of the United States. It’s also possible that the midterm elections target higher ed, notably Republicans slamming the academy for being too woke, anti-Trump, etc., which might have some impact.
The new Clearinghouse data does clearly support my Health Care Nation scenario, which I first posited in 2014 (more in this 2025 update). In that future allied health care (the full range of health services, from nursing and surgery to dentistry, mental health, hospital administration, etc) keeps growing until it’s the leading sector in the American economy. Higher education tracks this by expanding its offerings on that score. The swelling enrollment we learned about this week is certainly consistent with the scenario. 11% of all postsecondary study is health care now, or about 1 in 9 students across the board. I don’t think this gets nearly enough attention beyond the medical fields themselves.
Last note: the geographical findings are very exciting for southern campuses, but sobering for the northeast. Recall just how many colleges and universities are in that area. I asked Clearinghouse staff to speculate, and they confirmed my guess that the demographic transition was at work.
That’s all for now. I hope to host Clearinghouse leads this fall on the Future Trends Forum to discuss that semester’s findings. In the meantime, what do you make of their latest?
*The gender numbers don’t total a neat 100% because reports were missing some students’ gender data.



Thank you for this. I’m wrestling with how to think about the dual enrollment growth. I suppose we could feel good that it means more students are getting their feet in the door while in high school and will thus continue? My concern, on the other hands that it’s just one of the many ways, especially in my State (Indiana), that the full value of a college education is obviously being denied and undermined. By which I mean: if students show up at my for your comprehensive university already having the general education requirements done, do we really think they’re getting a full college degree? Another way to put it and I don’t mean to be implicitly critiquing any high school teachers: I don’t think a 16-year-old in a high school setting taking a class is the same experience as an 18 or 19-year-old in a college setting. (in our state, that’s how a lot of the dual credit content is delivered.)
Good questions and thoughts, Jake. Exposure to college classes should be a fine thing for high school students, most of the time. I wonder, though, how the college instructors change classes for the younger students.
Thanks as always for these insights, Bryan.
Maybe I’ve been doomscrolling too much, but I am reading macro non-education trends into these numbers. The uptick in dual enrollment in my area is driven not by marginalized students dipping their toes into collegiate waters to ease their way into degree programs, but by high-achieving high schoolers trying to stack up college credits to burnish their applications to selective and superselective institutions. Clearinghouse data aren’t detailed enough to confirm whether this is a larger trend outside my region. But to my eye, this is evidence of the broader separation between haves and have-nots.
Those students, as well as non-dual (single?) enrollees, still seek higher education despite the various forces warring against it. I also wonder, though, whether some of the enrollment revival is because institutions, especially community colleges, are adapting by offering more short-term credentials.
The declining number of students who are willing to share their ethnic and gender identities reflects the broader societal decline in trust in institutions. At least students still want to enroll.
Good points as always, sibyl. I can imagine a number of students stacking up college classes like APs. I worry about inequalities playing out along these lines.
Grim thought about data.