
How do we track the coronavirus as it hits higher education?
As fall semesters begin across the United States, some colleges and universities have taken to publishing their internal COVID-19 data. This often takes the form of dashboards hosted on webpages.
UPDATED October 23, 2020
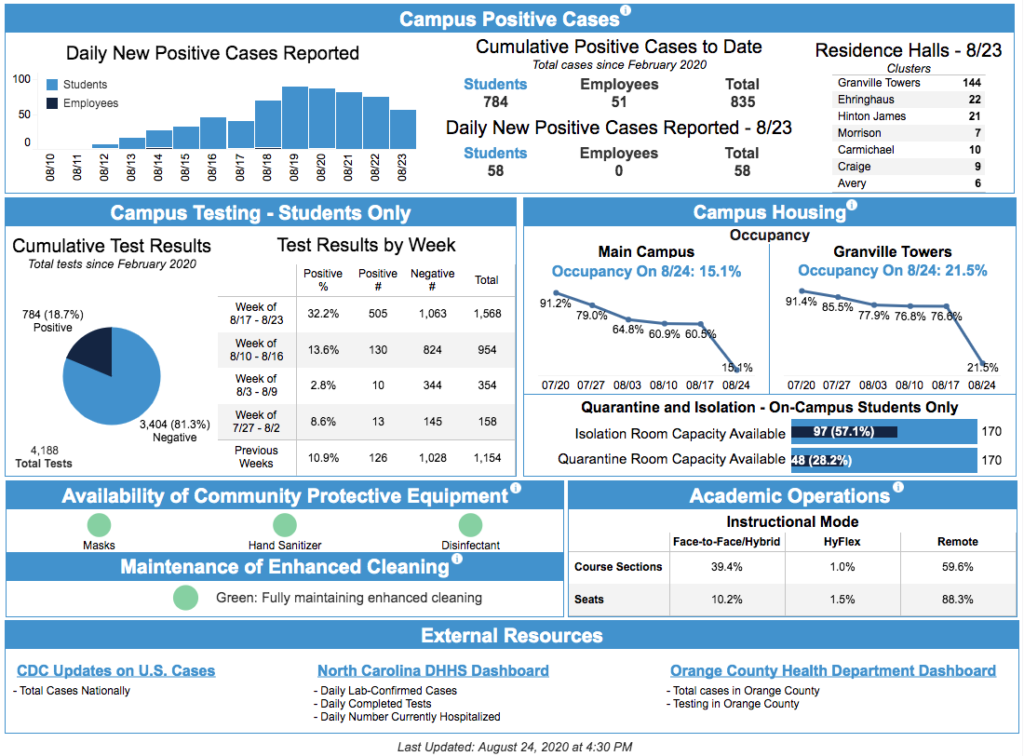
UNC Chapel Hill
This is an interesting development. The dashboards carry a range of data, differing by individual campus. They are an effort to reassure various populations about the pandemic, as well as to document its development.
I wrangled a group of these to explore (see end of post for credits to helpers). It seemed useful to have them in one spot:
- Appalachian State University
- Augusta University
- Benedictine College
- Boston University (article about it)
- Carleton College
- Clemson University
- Colby College
- Colorado State University
- Columbus State University
- Cornell University
- Creighton University
- Davidson College
- Duke University
- Franklin and Marshall College
- Georgia College
- Gordon State College
- Hiram College
- Elizabeth City State University
- Elon University
- Fayetteville State University
- Georgia Southern University
- Georgia Tech
- Gettysburg College
- Illinois State University
- Indiana University Bloomington
- Kenyon College
- Lewis and Clark College
- Liberty University
- Marquette University
- Michigan State University
- Middle Georgia State University
- Missouri State University
- Northeastern University
- Northern Michigan University
- Northwestern University
- Norwich University
- Oberlin College
- Ohio State University
- Penn State University
- Purdue University
- Reed College
- Roger Williams University
- Rutgers University
- Saint Olaf College
- State University of New York (SUNY) system
- Stony Brook University
- Swarthmore College
- Syracuse University
- Towson University
- University of Alabama system
- University of California-Berkeley
- University of Colorado-Boulder
- University of Connecticut
- University of Dayton
- University of Florida
- University of Idaho
- University of Illinois-Urbana-Champaign
- University of Iowa
- University of Kentucky
- University of Maryland
- University of Miami
- University of Michigan
- University of Minnesota
- University of Missouri
- University of Nebraska-Lincoln
- University of Nevada-Reno
- University of New Hampshire
- University of North Carolina-Asheville
- University of North Carolina-Chapel Hill
- University of North Carolina-Charlotte
- University of North Carolina-Greensboro
- University of North Carolina-Pembroke
- University of North Georgia
- University of North Texas
- University of Notre Dame
- University of Richmond
- University of Rochester
- University of Texas-Austin
- University of Vermont
- University of West Georgia
- University of Wisconsin
- Vanderbilt University
- Vassar College
- Western Carolina University
- West Virginia University-Morgantown
- Williams College
- Yale University
- York College of Pennsylvania
Some features are widespread, such as posting the number of tests and infections on a given campus. Infections can appear as a total number accumulated over time, or set apart by weeks. Some offer a time series showing data separated by weeks or other periods:

Test results appear in positive and negative outcomes. Among tests, some distinguish between symptomatic and surveillance tests. Others break out tests applied to students before they hit campus or by where on campus they get tested. At least one divides students based on if they are from near the campus. One separates cases by “Active COVID-19 Cases with DIRECT Campus Impact” versus “Active COVID-19 Cases with INDIRECT Campus Impact.” (caps in original) Several (for example) include local or regional testing data within the same webpage.
Campus populations are usually broken down by status: staff, students, faculty, subcontractors. Campus responses to the pandemic appear, often in the form of the number of people placed in isolation or quarantine.
All dashboards include links to campus policies: reopening, how to get tested, how to find health resources, privacy, etc.
Other dashboard details are less common. Not all use graphics while some deploy a range of visual designs. Jeremy Anderson approvingly sees some of those as minimalist. Maryland has a nice two-window approach, letting users switch between overview and detail views.
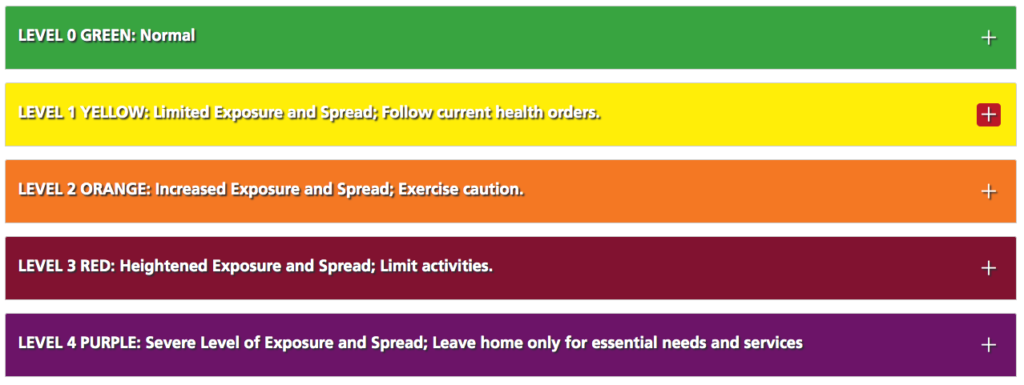
Some share medical resource (PPE, rooms, etc) data. Several add a multi-tier alert designation:
Several dashboards offer short descriptions of events, like this one from Lewis and Clark College:
08/15/2020
student
College of Arts and Sciences
Student moving onto campus tested positive and is in isolation. One exposed staff member in quarantine. No other known exposures.
A few distinguish between on- and off-campus students.
A range of software powers these dashboards. I’ve seen a bunch in Tableau, along with PowerBI. At least one is a pdf hosted on Google Docs. There must be some homebrew work going on as well. A few host mobile-oriented versions.
Update timing varies widely: weekly, daily, ad hoc.
I have some questions. Has anyone aggregated these dashboards somehow, forming a synthetic picture of COVID on American campuses? How widespread will these data projects become? Most of my samples come from research universities. Are institutions that don’t emphasize research as highly as these also publishing dashboards, and I’ve just missed them?
At another level, what do these dashboards say about American higher ed in fall 2020? In one light they represent an effort to be transparent to the world, sharing updated data for all to see. In another view they are defensive statements, arguments that each campus is on top of the crisis, and that things are under control. The visual rhetoric emphasizing data draws on the powerful status of data, indicating for many people a mix of intelligence and objectivity. The textual rhetoric describing individual cases aims for a similar objectivity, drawing on the prose styles of medicine and policing. These are calming, soothing, cold dashboards, designed to assure users as much as to inform them.
This is by no means a full account of campus COVID dashboards. It’s a first attempt to pin down a fast-moving target. I’d love to hear from developers and administrators about their dashboard planning ideas. And if this is useful I can update the page to include additional boards.
(thanks to Jeremy Anderson, Brian Basgen, Mark Kozitka, Eric Stoller, Rick Moore, Bill Allison, Todd Bryant, Joe Murphy, Charley Kline, Matthew Boedy, DRo, Sarah Prescott, Brian Rejack, Andy Morton, Joel Bloom, Mass Union Faculty, Jessica McQuain, Mark Greenfield, and Peter Shea for links; this Andy Thomason thread was amazing; this page has a great list and I wish I knew more about it)



For your list: https://splunk-public.machinedata.illinois.edu:8000/en-US/app/uofi_shield_public_APP/home
Lisa, that takes me to a login page. Is there a public-facing one?
Try https://go.illinois.edu/COVIDTestingData for the University of Illinois.
It redirects to the same site, but seems to get around the need to login that you get if you go there directly.
That works – thank you.
Kenyon’s dashboard is at https://www.kenyon.edu/return/dashboard/
Thank you, Joe. Does Leeman have one for the town?
I’m not aware that we’ve got a separate village-level dashboard page, though village-level (and county-level) data from the Knox Public Health Department is integrated with the College’s dashboard. There’s also a page linked from that dashboard with results from a study of the village’s wastewater (which is a collaboration between the village and the Bio department).
Very good.
Here is University of Miami’s lame contribution: https://coronavirus.miami.edu/dashboard/index.html
Thank you, Scot.
Here’s a simplistic one from Georgia College in Milledgeville, GA. https://www.gcsu.edu/coronavirus/managing-covid
Thank you, Jessica!