
Here’s a good visualization of how demographics are changing education. Two Hechinger authors, Isaac Carey and Jon Marcus, built a good map based on WICHE data:
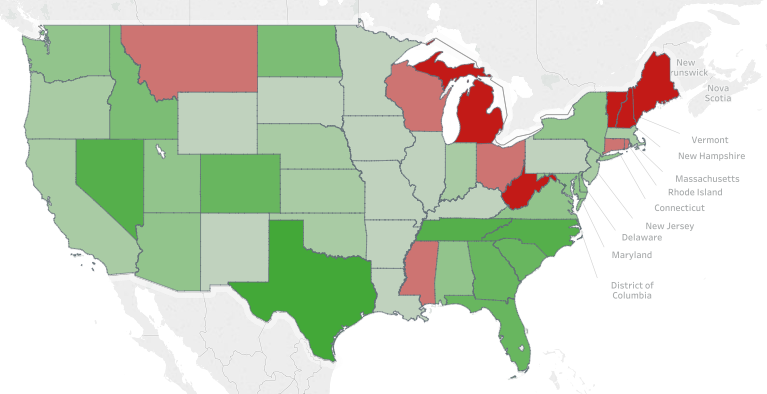
This charts projected high school grads for 2031, based on current demographics and graduation patterns. It matches what I’ve been observing for years.
A few reactions:
- Note the continued shrinkage of most of New England. I suspect Boston is an outlier for Mass.
buy fluoxetine online buy fluoxetine no prescription generic
- West Virginia and major parts of the Midwest keep losing teens.
buy synthroid online buy synthroid no prescription generic
- The South and Texas continue to boom.
- I’m not sure why Mississippi breaks so far from the rest of the South. Ditto Montana.
What happens to higher education in those red zones, especially those teaching traditional-age undergrads? It’s not a surprise that those states are overrepresented in queen sacrifices. Mergers and possible closures might lie ahead in greater numbers. Inter-institutional collaboration might be even harder to accomplish.
Think about how colleges and universities will be targeting the deep green states for recruitment even more intensely.
We should expect alumni and development links to build there, too.
How else will these “red” states respond? Perhaps there will be more interest in closer connections between secondary and post-secondary systems, as the latter tries to increase the flow of students from the former. Will state politicians activate old culture war tropes about getting women to have more children, or will they advocate policies aimed at increasing migration to their states?
(thanks to Vanessa Vaile for her editorial eye!)



Don’t you mean Mississippi? Not Louisiana…unless the colors on the map are wrong.
Whoops! That’s what I get for blogging instead of sleeping.
Corrected, and thanks.
Pingback: One college will close its entire undergraduate program | Bryan Alexander
Pingback: On the solstice, dark thoughts for 2018 | Bryan Alexander