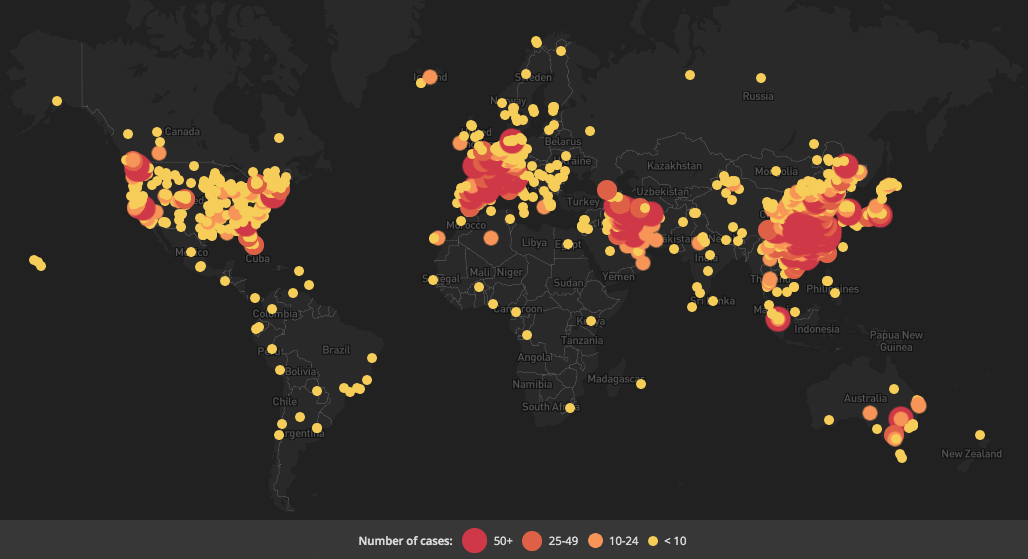
It’s March 18th, COVID-19 keeps spreading, and the world’s reactions are deepening. Global infected numbers passed 180,000 and deaths near 9,000, reportedly (and there are doubts about numbers). There are more infections and deaths outside of China than in, according to WHO, who maintains a global risk assessment of “very high.” The coronavirus is racing through Europe, throwing Italy into a nationwide quarantine and medical horrors. Spain is next up. France and Germany have tightened their borders. In fact, most of Europe is raising border shields. The British government is reconsidering its herd immunity plan after a high profile report thought it could lead to up to hundreds of thousands dying. Some leading US politicians are referring to COVID-19 as a “China virus” while some Chinese representatives blame it on the US or Italy. Canadians (of course) are calling for caremongering. The disease is heightening economic inequality. Sex workers are losing business.
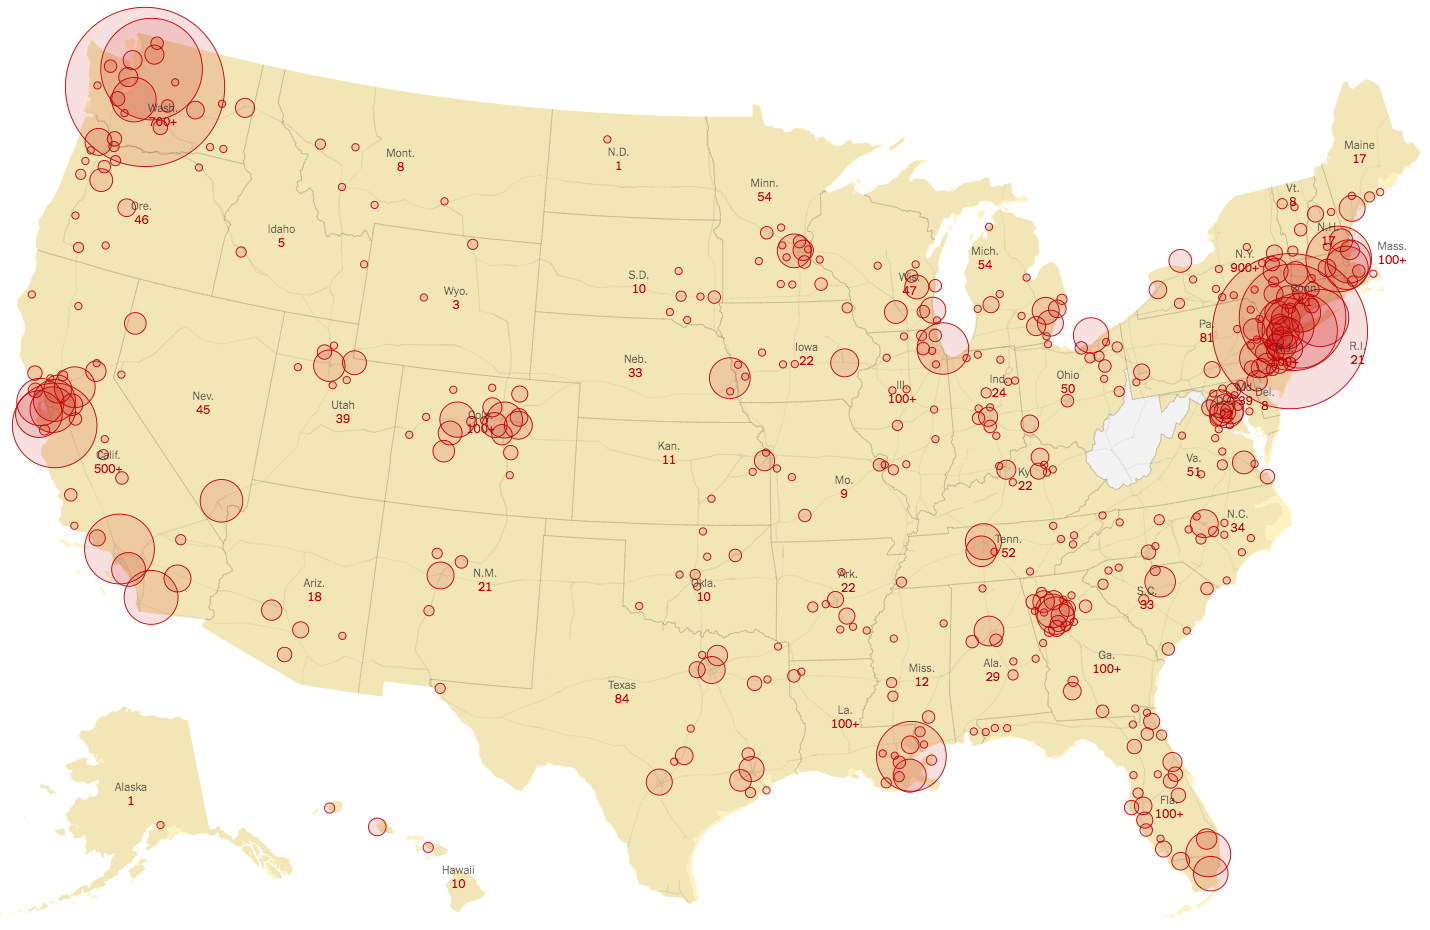
 In the US, there are 3,487 infections and 68 deaths, according to the CDC. The stock market is in chaos after the worst fall since the Cold War; some finance people have gone beyond fearing recession to muttering about the d-word. Trump now seems to take things seriously, calling on Americans to avoid gatherings of more than 10 people, and even agitating for a yuge stimulus bill, but most people don’t believe him. More than a dozen Congresscritters have quarantined themselves as is the outgoing White House chief of staff. New York State’s governor called for federal troops to expand that state’s medical capacity. San Francisco imposed a shelter in place edict and New York City is thinking about it. Medical workers are starting to get infected. Sports are shutting down and celebrities are getting sick, which means This Is Now Real for a lot of folks. Alamo Drafthouse movie theaters closed up. One vaccine is being trialed in Washington state, appropriately.
 That’s a snapshot of the present. Now let’s look at some current futures work that anticipates COVID-19’s near future.
In this post I’ll share a series of forecasts. This may give you insights on how to plan for what’s next, as well as give a sense of how futures work can be done during a major crisis.
(The numerical order below is arbitrary)
 FORECAST 1 Amesh Adalja (Johns Hopkins University Center for Health Security) offers a less frightening vision than most in an interview with Sam Harris. Adalja thinks the case fatality rate (CFR) is actually much lower than others have found. His 0.06 rate is six times more lethal than seasonal flu, but far less homicidal than other rates I’ve seen.
Adalja emphasizes several factors in creating that rate. Data collection so far has often been skewed by comorbidities and what he calls a “severity bias.” Adalja relies on South Korean data, which he deems the most robust. He fears state overreaction causes some medical problems, including capacity shortages and extraneous deaths (pointing to China and Italy). Additionally, COVID-19 is not that strong a virus materially, having a delicate fatty layer that, dried out, kills the thing.
As a result of this low CFR, the coronavirus should play out like a bad flu season over the next few months: a good number of infections, a small number of deaths suffered by susceptible people.
I recommend listening to the whole podcast. Harris asks good questions and Adalja answers with admirable concision.
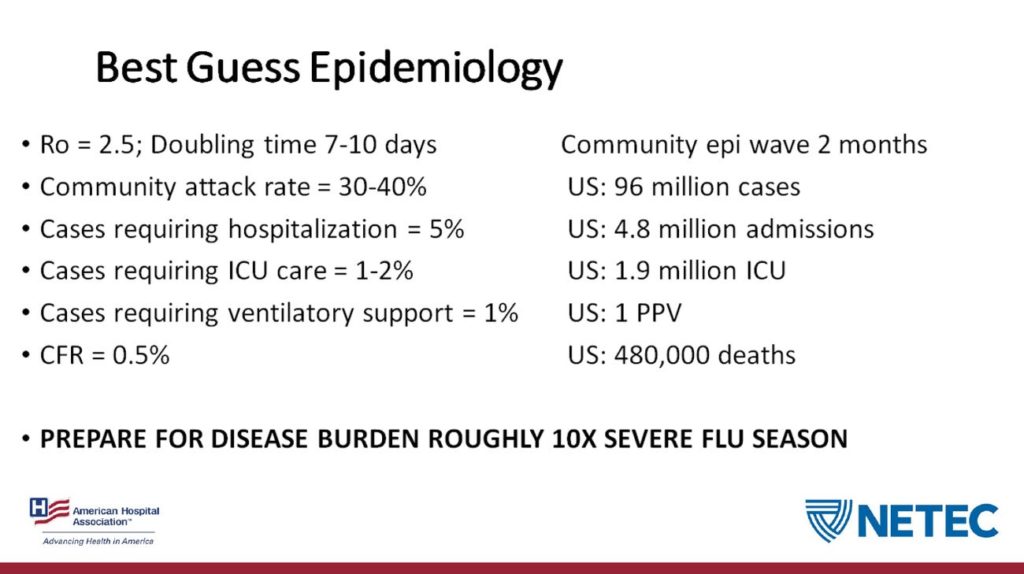
FORECAST 2 On March 6th Business Insider shared a “leaked” slide from an American Hospital Association webinar. The presenter was Dr. James Lawler, associate professor of medicine at the University of Nebraska’s Global Center for Health Security.
The slide forecasts the course of a coronavirus outbreak in the US over two months:
First, some caveats from the BI article:
The slide does not give a particular time frame.
The slide represents “his interpretation of the data available. It’s possible that forecast will change as more information becomes available,” a spokesman for Nebraska Medicine told Business Insider in an email.
The American Hospital Association said the webinar reflects the views of the experts who spoke on it, not its own.
I’d add that we don’t know the rhetorical situation. Was this a worst case scenario? Was he trying to soothe or freak out the audience?
Second, a few clarifying attempts. R0 is reproductive rate, how many people a given infected person will infect. Community attack rate: I think that’s the proportion of a population who get infected. ICU: intensive care unit. CFR: case fatality rate, or what proportion of people the virus kills. PPV: I don’t know.
Third, some discussion. Dr. Eric Feigl-Ding has a good Twitter thread raising issues about key points. The CFR is on the low side, as is the ICU number (Italy’s seeing 10%). It presumes no public health measures. Degradations to health services through staff getting sick, supplies running low, or competition for scarce beds (see below) don’t play a role.
All of that said: this single slide gives us one way to think ahead about COVID-19. It introduces non-experts to key terms. It uses statistics. The result is a kind of thin scenario, a glimpse of how things might unfold. Rhetorically, it can spur us to action: to learn, to take public health seriously, etc.
FORECAST 3 Dr. Liz Sprecht fired off a Twitter thread exploring how the outbreak/ pandemic might stress medical services. Then she developed the thread into an article. She’s associate director of science and technology at the nonprofit Good Food Institute.
What drives this instance of futures thinking is the extrapolative method:
We can expect a doubling of cases every six days, according to several epidemiological studies. Confirmed cases may appear to rise faster (or slower) in the short term as diagnostic capabilities are ramped up (or not), but this is how fast we can expect actual new cases to rise in the absence of substantial mitigation measures.
That means we are looking at about 1 million U.S. cases by the end of April; 2 million by May 7; 4 million by May 13; and so on.
Sprecht focuses her exercise on two crucial medical metrics: available beds and masks. Read through to see just how bad she thinks it’ll get.
I want to give the author additional credit for showing ways her extrapolation could vary, based on different numbers:
If I’m wrong by a factor of two regarding the fraction of severe cases, that only changes the timeline of bed saturation by six days (one doubling time) in either direction. If 20% of cases require hospitalization, we run out of beds by about May 4. If only 5% of cases require it, we can make it until about May 16, and a 2.5% rate gets us to May 22.
Why do these two metrics matter? It’s clearly horrible that hard-working medical staff may suffer, and some will die. On top of that, let Eric Feigl-Ding explain:
Vicious cycle of spiraling worse care with epidemic: Why does CFR differ so much & why is it higher in extreme epicenters? Cuz hospitals+ICUs get overloaded, doctors/nurses are overworked/quarantined out of commission ➡️ this yields a vicious cycle of worsening care. #COVID19 pic.twitter.com/0ROBnZTM1Q
— Eric Feigl-Ding (@DrEricDing) March 8, 2020
FORECAST 4: Another forecast Twitter thread comes from infectious disease scientist Stephen Riley, who wants us to think ahead at a social scale. First, he urges us to recognize COVID-19 will be with us for a long time:
#COVID19 is now a part of our world and things are different. Things will get back close to the old normal only when most people have immunity. We have two ways to get immunity – natural infection or vaccination, but vaccines don't yet exist. (1/n)
— Steven Riley (@SRileyIDD) March 8, 2020
As a result, massive and sustained quarantines means changes to our societies:
It may be then that most of us will acquire immunity via natural infection, but I do not accept that. I think it is worth the most incredible coordinated human effort to create slightly different societies in which the virus cannot spread widely. (2/n)
— Steven Riley (@SRileyIDD) March 8, 2020
No metrics here. Just a forward glance at the likelihood of social transformation.
To sum up: four different views of COVID-19’s future, each using a different approach.
Coming up: more forecasts from other people, then some of my own.
(thanks to Steven Kaye and many others; stay uninfected, you all)


Thanks. A few observations.
First, its amazing how little agreement there is about the “death rate,” which several credible sources were putting down as 3.4% not long ago. Example: https://www.sciencealert.com/covid-19-s-death-rate-is-higher-than-thought-but-it-should-drop
The huge differences in estimates are crucial to understanding the extent of the crisis. It does make sense to me that South Korea would have the best numbers because their robust testing process gives us the best transparency. If it really is .06, then that’s good news and probably affects the way we approach it.
Second, Dr. Liz Sprecht seems to be badly underestimating the speed of the spread of the virus in the US. The US, for example, had 3,774 confirmed cases on the morning of the 16th and now has 7,769 cases on the 18th at 6pm EST. In other words, it doubled in only a little over two days. I have no idea how much of this is a function of testing (and the lack thereof), but I do know that that rate has been fairly consistent throughout the US experience (that is, more than doubling every three days).
Third, there’s no information about how much social distancing could slow it and blunt its force, but the examples of China, South Korea and Japan clearly show that it can have a huge impact IF it can be properly instituted and enforced (through cultural pressure, policing, or any other force). We need to understand this better to work it into our forecasts and planning. We also need some metric to determine how well we unruly Americans are actually implementing social distancing. Because if we’re not doing it well now, we need to react to that immediately rather than a month down the road when it’ll be too late.
I think you’ve misquoted Adalja. I’m pretty certain he said 0.6% not 0.06%.
Yeah, this should be clarified. I suppose it may be both .006 and .6%.
Here’s an interesting angle that offers a glimmer of hope:
https://www.zdnet.com/article/graph-theory-suggests-covid-19-might-be-a-small-world-after-all/?ftag=TRE-03-10aaa6b&bhid=24062731044554874077662107142328
and
https://www.medrxiv.org/content/10.1101/2020.02.16.20023820v2
Forecast 1: Interesting
Forecast 2: March 6th – would love to see an update based on what’s happened in the US over the last 2 weeks.
Forecast 3: cites “several epidemiological studies” – the linked one is from Jan 31.
Forecast 4: Not a lot of substance there… dated March 8th.
What is horribly lacking is quality peer-reviewed papers that are accessible and readable by the public with current information. Yes, I recognize that “fast” and “quality” are often opposite dynamics…
In the end, it’s all about the assumptions, isn’t it? Four rather different forecasts based on four different assumption sets. Likewise, the Imperial College study (which is being discussed on your FB feed) makes a lot of assumptions, but it’s hard to know how accurate they are.
I happen to think that the NESCI critique of the Imperial College model https://necsi.edu/review-of-ferguson-et-al-impact-of-non-pharmaceutical-interventions?fbclid=IwAR0uIhnf4joLlgj1PnuXHTQiK0S2OfVTvONXQumv1SyKGDmRqyeTi5R5EO has a lot of merit for which there is available evidence.
– There are no cases where a country’s coronavirus infection trend has exhibited ergodicity over the time period modeled by Imperial College and other models. Instead, the trajectory decreases eventually before the exponential increase reaches catastrophic levels. This is the case so far with China and South Korea, as well as other Asian countries which reacted quickly and effectively (e.g., Taiwan, Japan, Singapore)*.
– I don’t know enough about models to assess the accuracy of NESCI’s claim that the Imperial College model is “not well suited for incorporating real world conditions at fine or large scale” such as “significant interactive local dynamics and travel restrictions that cannot be seen from aggregate quantities or averages across geographic locations or “dynamic or stochastic values of parameters that arise from variations in sampling of distributions as well as the impact of changing social response efforts.” But I have seen other sources which talk about how the rate of virus spreading has limits because of people’s daily interaction patterns, e.g., they’re going to interact with mostly the same people every day instead of different people, so the number of potential ’targets’ decreases eventually.
– It’s also very clear that there are very different rates of social interactions in different parts of the country in terms of density, frequency, and churn. One could make a case that the most highly affected areas to date (e.g., NY, SF Bay Area) are among the ones with the highest values in this regard. At any rate, it is not hard to imagine a slower rate of spread in areas of the country where social interaction patterns are different.
– It would be nice to know more about some measures which are happening. For instance, what kind of contact tracing is the US doing right now?
A key indicator will be to watch what happens in Italy (and to a lesser extent, Spain, Germany, and France) over the next 10-14 days. If, for example, the number of new cases in Italy rises to 6-7K/day and shows no signs of leveling off, that would be worrisome. If, however, the number of new cases rises starts to level off, that would be an indicator that existing measures are succeeding in preventing the virus from spreading at exponential levels. I believe it would make the difference between a social distancing regimen of 4-8 weeks and one of 4-6 months, which would be far more catastrophic for society.
None of this is to minimize the present and future effects of this crisis. Even NESCI agrees that suppression is necessary to “flatten the curve” as much as possible. The coronavirus may well kill tens of thousands of people in the US, if not necessarily in this go-round, then within the year. And there will be areas where brute triage will be practiced out of necessity, and it will be ugly and shameful. But I don’t see that the evidence supports a policy of comprehensive suppression for the period called for in the Imperial College study (i.e., through September 2020) at this time, nor that there will be hundreds of thousands of deaths in the US from this virus. I also believe that, the longer that major suppression goes on, the better the US will get (and quickly!) at instituting methods not dissimilar to those used in China and elsewhere.
The blunt truth is that this pandemic is not yet real to large swaths of the country. Let’s see what happens, for instance, after the inevitable spike in cases after all those college students return from Spring Break to their various locations across the country. Or when other prominent social distancing flouters have cases in their communities where many people still believe “it can’t happen here.” Some of these areas may well have bumps in their curve and perhaps even overwhelm their local resources, but it will help shock them into line and ultimately reduce the amount of time needed for social distancing and other suppression measures to remain in place.
That is my opinion based on my own very amateur assessment of the situation. Perhaps it’s based too much on hope, but again, I agree with the NESCI critique of the Imperial College study and feel that the study results are being accepted and spread with a little too little criticality.
*BTW, based on the worldwide response to this thus far, I believe that historians looking back will mark this event as the dawning of the Asian Century, although in reality it arguably started some time ago.